Identifying Hosts Class and Detecting Anomalies in Hosts Activity by Passive Network Traffic Monitoring
1. Relevance
Modern plants, as well as large trains and ships, use data transmission networks. Most of the time this data is quite critical and consequently worth protecting. The market offers quite a few network security tools and solutions but in order to use them it is important to know what kind of hosts operate on this protected network, what are their addresses, and how do they interact with each other.
In this article, we’ll focus on one of the methods used to identify network hosts type by a trendy machine learning algorithmn.
One could certainly think that there are numerous tools (including Nmap — one of the most well-known) for network host class remote identification. What’s the point in re-inventing the wheel, right? The thing is, popular tools generally use active scanning and this is not something we’d desire to happen in the industrial network. Whatever good intentions it may have, an annoying scanner is constantly polling hosts and consequently can cause PLC failure (each additional unnecessary packet is a reason for PLC to freeze or reboot).
What’s more, available tools are designed for allocating the network hosts to a limited class set, based on some predefined rules. Any object, that was not explicitly covered by the ruleset, stays unindentified. The method we’re going to cover here is free of this limitation. As a bonus, it facilitates both inventorizing your assets and identifying anomalies in hosts’ information exchange flows.
If, for some reason, using active scanning tools is impossible, one has to resort to manual host identification and description (no choice here, we’ve got to know what assets need to be secured). To automate this we can utilize a method for host class identification based on an observed network traffic profile. This method does not require any interaction with the network and ensures protected system integrity.
2. The idea
This method is similar to IDS operation principle: intercept and store all traffic. Next, divide the traffic into flows — connections between hosts with unique addresses that use a unique set of different level network protocols. Next, count how often a host uses one or another protocol set and generate a feature vector out of these numbers. Finally, choose an optimum model architecture using marked hosts from a training set and AutoML methods, and train it afterwards.
The trained model receives feature vectors of the unindentified hosts, and as an answer, we obtain their assumed types. That is it, all hosts are identified and allocated.
Detecting anomalies takes even less data. Using the described method to generate a feature vector for each host. Since we apply a supervised learning algorithm (allocation to classes is unknown in advance), we will need to determine an optimum number of clusters and divide hosts among them. Using cluster numbers as answers, we can train a neural network with the available data. In subsequent operation, new flows detection will require updating the hosts’ feature vectors and predicting their classes with the neural network. If the class matches the one previously known — do nothing; otherwise [ring the alarm, we are under attack!] register an anomalous activity for the host. In order to determine the severity of the event, we can apply hierarchical clustering additionally to custom clustering when dividing hosts into groups. Subsequently, we can indirectly define event severity by cophenetic distance (distance from one node to another in the hierarchy). For example, an appearance of a new client of the file server and a new management flow to a switch, a flow which has never been detected before, are events with quite different severity levels.
3. The math (formal model)
Sometimes mathematics is called a universal language of science. Let’s try and translate the idea of network host class identification and make some parts more specific.
The model takes protected system network traffic as its input. Let’s name a set of network packets using the same protocols in every network layer involved and sent from one network address to the other a flow. A vector of characteristic
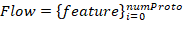
describes Flow, where it’s length numProto depends on the number of the network protocols in the packet.
Therefore,
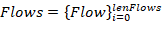
characteristic set describes the entire flow set Flows with length lenFlows:
Figure 1 — Flow group
Source addresses set is used with all numProto network model layers as an identifier for each host from allocated hosts array Hosts with length lenHosts.
Addressing levels number numProto reflects the number of the nested protocols:

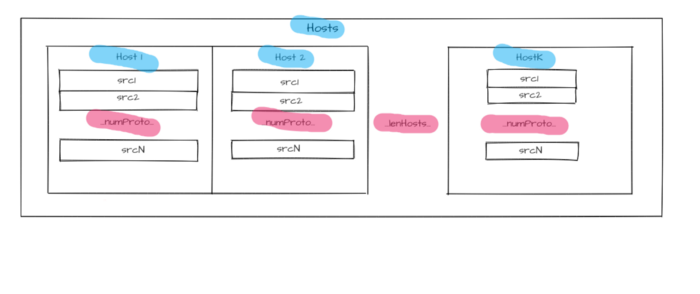
Figure 2 — Hosts identifiers
The main characteristics for each host include relative flows number hosts.num_flows and protocols used in these flows. For each host,

vector of characteristics is described. Its length host.numKnownProto matches the total number of identified protocols (all layers) in the entire flow array. A number from 0 to 1 characterizes each frequency element and depends on the number of host flows containing a respective protocol.
A host has a
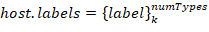
label set. Each set describes a host belonging to one of the classes. Class groups are formed independently by two attributes: host role (i.e. PLC, Workstation, Active network hardware,…), operating system (Windows XP, Windows 7, Linux Ubuntu, Linux CentOS, …).
Another characteristic of each host is the proportion of flows linking it to hosts belonging to specific classes host.connectedWith.
To make the host description suitable for the machine learning models essential characteristics are set as a host.vector host characteristic vector. We can also add other information about the host in form of the host.some_inf. This vector combined with information about protocols usage frequencies constitutes host.vector = {host.proto,host.some_inf} host traffic profile or characteristic vector.
Source data
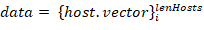
for a model is represented as a hosts characteristic vectors set. Prior information about hosts classes is required to train a model; therefore, it is necessary to set each

This means that the traffic dump should contain flows that correspond with all input data (sources addresses for each hostᵢ host), where the answer is known in advance — label host type.
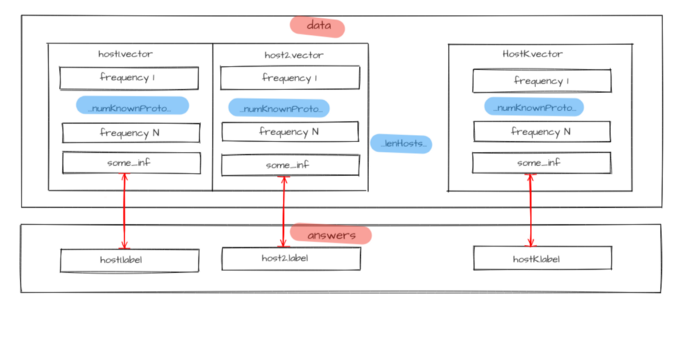
Figure 3 — Source data for model training
Available traffic with labeled hosts is divided into two parts: one for training and another for testing. First, the model is trained on the training set with host.label parameter values as answers known for all hosts. Then the model identifies hosts from a test set. Selected metrics will assess the model operation quality after comparing predicted host.labelPredicted and host.label prelabeled classes. If it meets the specified requirements, the model is saved, otherwise, model structure or its hyperparameters undergo changes, and the training cycle (training, testing, and model changing) repeats until the model makes predictions with sufficient quality.
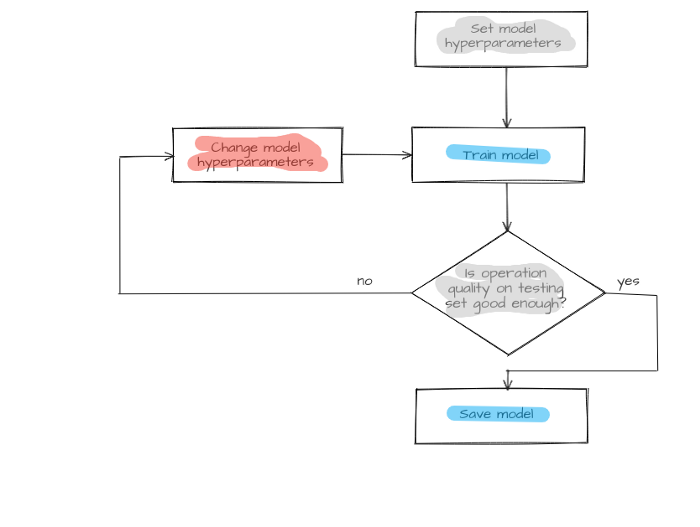
Figure 4 — Model creation process
And now let’s switch to the second task: anomalies detection in network traffic. Here the characteristic vectors should be selected from the flow set. They are to be divided into groups through clustering models. Each host will get a class according to its group number. Consequently, the entire multidimensional space, with dimension equal to characteristic vector length, will be split into multiple domains. The number of the domains will be equal to the number of clusters.
Concurrently, the hierarchical clustering model is used for cluster analysis. It will form a division saved for use during the next step.
When a new Flows flow group appears, host.vector host characteristic vectors will be updated and sent to the model input. Model operation results are saved in a respective host property host.new_label and compared to host.label known host clusters. If there is a discrepancy (hostᵢ.label ≠hostᵢ.new_label) it will be considered an anomaly. Flows flows that have led to this discrepancy (flows that changed host characteristic vector host.vector) are considered anomaly initiators. An operator will get an alert concerning potentially dangerous flows and host host specifications for the host that has displayed anomalous behavior. Hosts division formed by the hierarchal model is used to determine severity. The severity of a host moving from one group to another equals cophenetic distance between an anomalous host and its new nearest neighbor.
If there are no discrepancies between already known and newly received classes (hostᵢ.label = hostᵢ.new_label) the model will train again. In this case, hosts’ updated (multidimensional space undergoes re-layout) characteristic vectors host.vector are used as input data. Subsequently, the model goes into standby mode while waiting for the next flow set. A new hierarchical division is also formed. It is deemed that this time no anomalous behavior has been detected.
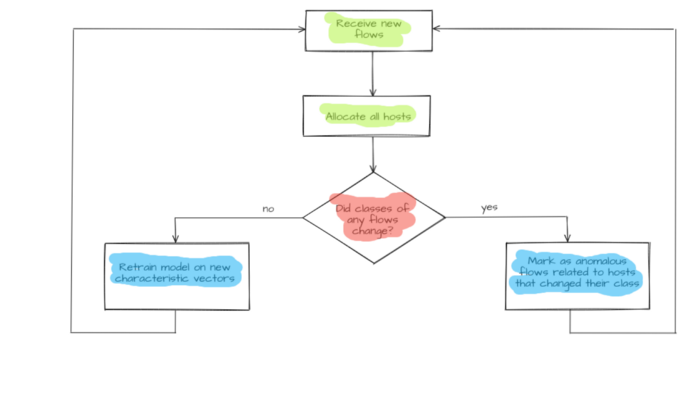
Figure 5 — Anomalous flows detection
The described formal model helps determine classification features and detect anomalies in hosts behavior.
4. Model implementation
The traffic flows were collected using the DPI module of the CyberLympha DATAPK product. Characteristic vectors were formed from these flows by a Python script.
One of the ways to choose an optimal model architecture is to use an automated machine learning method TPOT offered in TPOT module for Python.
As a result, we have designed a two-block ensemble that is united by stacking method. The first block includes K-neighbor models united by the stacking method as well. Answers given by lower layer models are additional features for upper layer models.
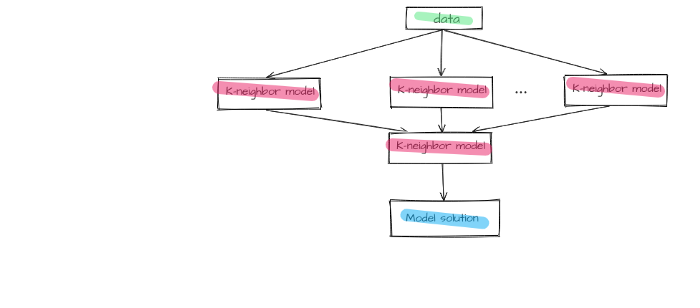
Figure 6 — First block of the final model
The second block includes a naive Bayes classifier model with minimum smoothing.
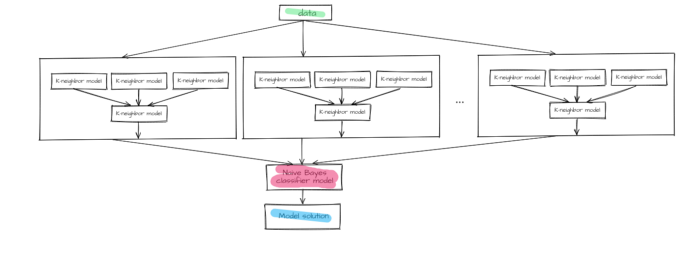
Figure 7 —The final model
The chosen model is implemented by means of the sklearn library.
Anomaly discovery is handled by the DBSCAN method for initial clustering, the SciPy library for hierarchical clustering, and a neural network for hosts allocation to the groups.
5. The results
So far, the available data is insufficient for estimating the accuracy of the module operation. It is still too soon to talk big about the numbers achieved until the product reaches the phase of field testing. During test sessions using available data (other than in the training set) F1- measure accuracy reached 80%. A loophole was implemented for situations when the model is unsure about the decision. In this case, it is acceptable to offer the choice between the two most probable classes to the end user. This allows F1 measure to increase up to 95–98% however if we compare the amount of such cases to the total set we can clearly see that they are rare. Therefore, this option can be considered worthy.
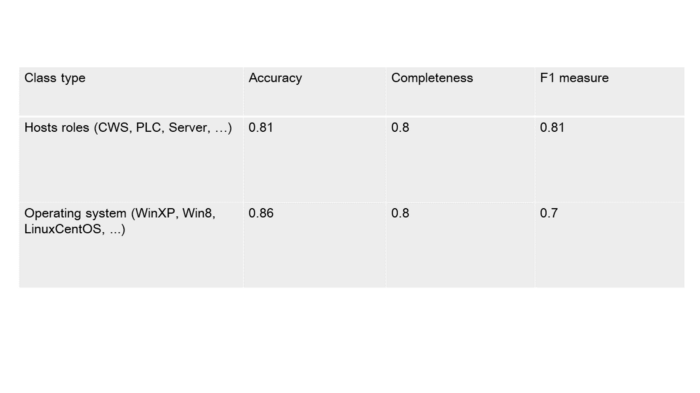
Table 5.1 — Classifier operation accuracy
We are going to consider a confluent though simple and understandable example to demonstrate capabilities.
Let’s assume that four active hosts operate in an enterprise network: a PLC, a SCADA, and two workstations (CWS). In this scenario the PLC interacts with the SCADA-server via Modbus (Ethernet, IPv4, and TCP at lower layers), the SCADA interacts with the workstation №2 via HTTP with the same lower-level protocols set, and with workstation №1 via SSH.
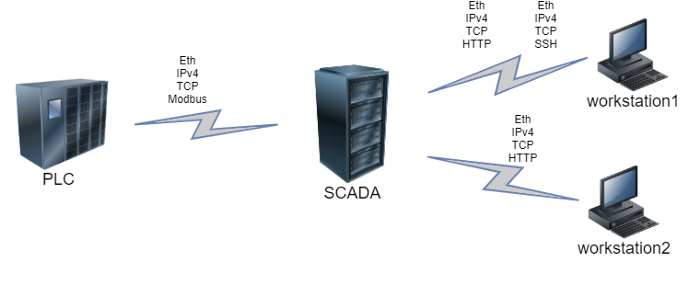
Figure 8 — Flows diagram
Let’s make a table containing protocols usage frequency by each host at each OSI layer:
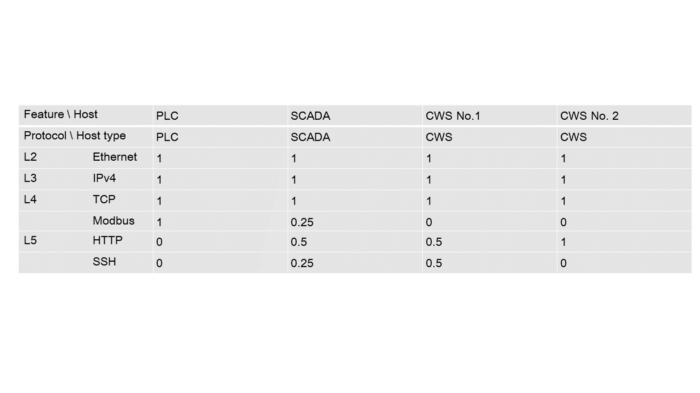
Table 5.2 — Protocol usage frequency by hosts
Now we can set a vector for each host according to the table above:
PLC = [1, 1, 1, 1, 0, 0]; SCADA = [1, 1, 1, 0.25, 0.5, 0.25];
CWS №1 = [1, 1, 1, 0, 0.5, 0.5]; CWS №2 = [1, 1, 1, 0, 1, 0]
You can see that the vector elements are the same for all classes. For this reason, we are not going to take them into account during model training. The last elements are the most important here.
Let’s save the vectors:
samples = [
[1, 1, 1, 1, 0, 0],
[1, 1, 1, 0.25, 0.5, 0.25],
[1, 1, 1, 0, 0.5, 0.5],
[1, 1, 1, 0, 1, 0]
]
And true classes for each example:
answers = [
‘PLC’,
‘SCADA’,
‘CWS’,
‘CWS’
]
Based on the support vector machine, we are going to create a simple model (the examples number is insufficient for the described model to learn).
from sklearn import svm
model = svm.SVC(kernel=’poly’, degree=3)
model.fit(samples, answers)
Now it’s time for our model to operate with new data. Let’s assume that we’ve added another workstation to the network. However, this workstation will differ from the previous two. It’s sole purpose will be SCADA-service control and it will only generate flows that use SSH protocol. Here’s an updated network scheme.
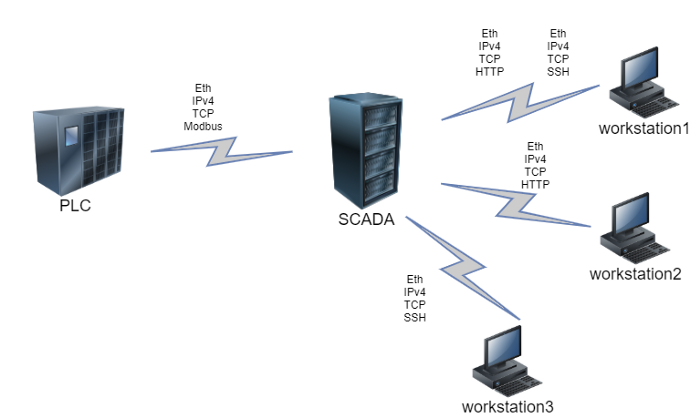
Figure 9 — New flows diagram
A new host requires one more feature vector, and the feature vectors for the existing hosts, that interact with the new node are bound to be updated. In this case it is the SCADA: usage frequency increases for SSH and decreases for other protocols.
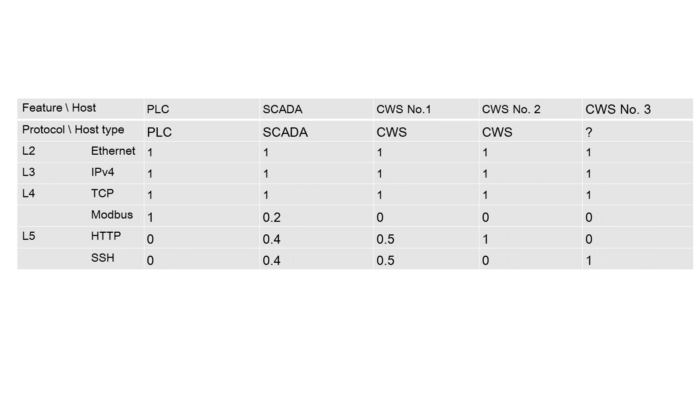
Table 5.3 — Protocols usage frequency by hosts after adding a new host
Let’s set a vector for the target host: CWS 3 = [1, 1, 1, 0, 0, 1];
unknown_node_vector = [
[1, 1, 1, 0, 0, 1]
]
And let’s see the prediction, given by the model we trained earlier:
model.predict(unknown_node_vector)
>>> array([‘CWS’], dtype=’<U5')
You can see that the model has generated the correct answer. In real life the service uses more hosts, each of them having more features, but the given example illustrates the operation concept quite well.
6. The reality
Currently, the described service exists only as a prototype. However, if and when it goes into release, there’s no doubt that security departments working at the plants and ships mentioned in the beginning, will save a lot of time on manual host type detection and assignment. Consequently the security personnel will be able to focus on non-trivial tasks, increasing the security level of company assets.
The technology described in this article has practical application in CL Thymus, CyberLympha’s AI/ML-based software, designed to protect OT networks and Industrial Control Systems that operate data exchange protocols based on unknown or proprietary protocols with no specifications available to the public.